End-to-End Monitoring with Datadog: APM + RUM + Traces Explained

Datadog monitoring dashboard showing APM RUM and distributed tracing for full stack observability

๐Ÿง  Introduction: Why APM + RUM + Traces Matter

Modern applications are no longer simple โ€” they are distributed, microservices-based, and user-driven.

Traditional monitoring answers:

  • โŒ Is my server up?

But modern observability answers:

  • โœ… Why is my checkout API slow?
  • โœ… Which user is facing issues?
  • โœ… Which service caused failure?

Datadog solves this using:

  • APM (Application Performance Monitoring)
  • RUM (Real User Monitoring)
  • Distributed Tracing

Together, they provide end-to-end visibility from user click โ†’ backend service โ†’ database query

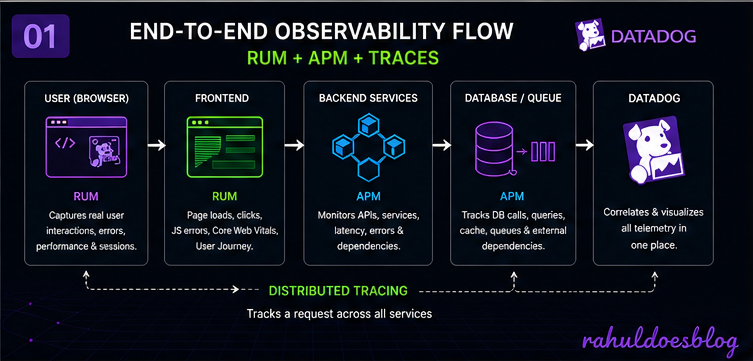
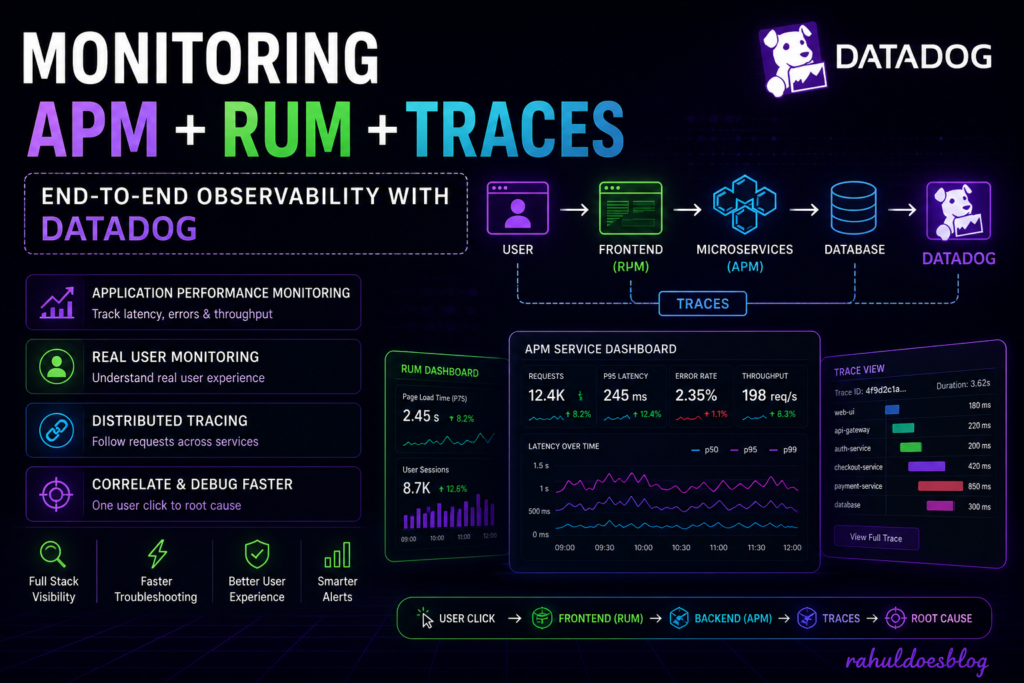
๐Ÿ—๏ธ Datadog Observability Architecture

Diagram showing user to database flow using Datadog RUM APM and traces

Flow:

  1. User interacts with frontend (RUM)
  2. Request hits backend services (APM)
  3. Request flows across services (Traces)
  4. Data correlated in Datadog UI

๐Ÿ” What is Datadog APM?

Datadog APM helps you monitor backend performance using:

  • Traces
  • Spans
  • Latency
  • Error rates

Key Concepts:

  • Trace = Full journey of a request
  • Span = Single operation inside a trace

๐Ÿ‘‰ APM allows you to:

  • Detect slow APIs
  • Identify bottlenecks
  • Monitor service dependencies

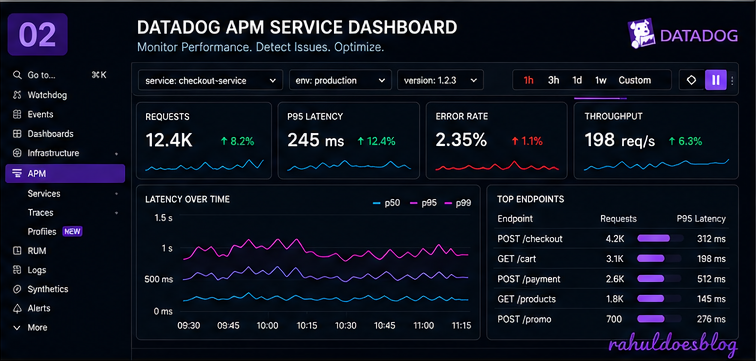
Datadog APM provides real-time visibility into services and dependencies across your stack

Datadog APM dashboard showing latency error rate throughput and service performance

๐ŸŒ What is Datadog RUM?

RUM captures real user interactions from browsers and mobile apps.

It tracks:

  • Page loads
  • Clicks
  • Errors
  • User sessions
  • Performance (Core Web Vitals)

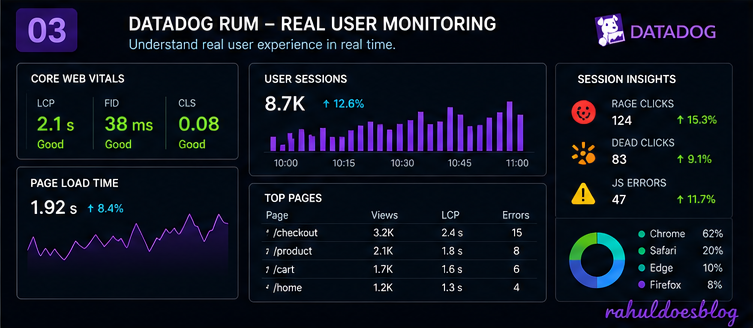
RUM provides visibility into real user journeys and frontend issues

๐Ÿ”ฅ Advanced RUM Insights

  • Rage clicks (user frustration)
  • Dead clicks (no response)
  • Slow page loads
  • JS errors
Datadog RUM dashboard showing user sessions rage clicks and performance metrics

๐Ÿ”— Connecting RUM with APM (The Game Changer)

This is where Datadog becomes powerful.

๐Ÿ‘‰ RUM + APM integration allows:

  • Link frontend issues โ†’ backend traces
  • Identify which API caused user frustration
  • Debug full request lifecycle

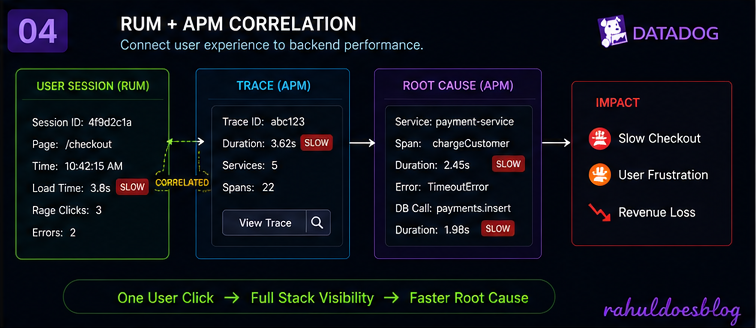
Datadog enables correlating frontend data with backend traces for full-stack visibility

๐Ÿ” Example Use Case

๐Ÿ’ฅ Problem:
User complains โ€œCheckout is slowโ€

Without Datadog:

  • Check logs manually
  • Guess root cause

With Datadog:

  1. RUM shows slow page load
  2. Trace shows slow API
  3. Span shows DB query delay

๐Ÿ‘‰ Root cause found in seconds ๐Ÿš€

Datadog RUM dashboard showing user sessions rage clicks and performance metrics

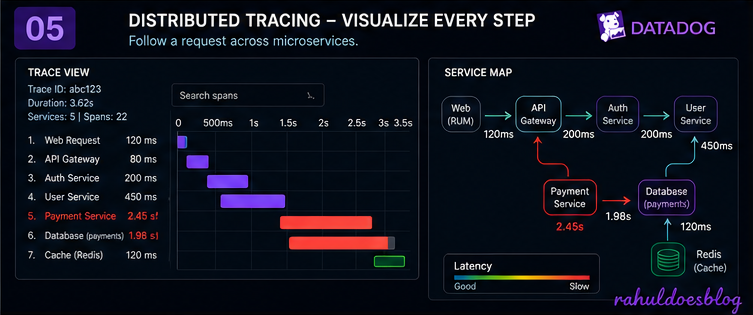
๐Ÿ”— What is Distributed Tracing?

Distributed tracing tracks a request across multiple services.

Example:

User Request โ†’ API Gateway โ†’ Auth Service โ†’ Payment Service โ†’ DB

Each step becomes a span inside a trace

๐Ÿ”ฅ Key Features

  • Flame graphs (visual request flow)
  • Service dependency maps
  • Trace explorer for debugging
  • Filtering and search capabilities

๐Ÿ‘‰ Trace Explorer helps analyze performance and isolate issues quickly

Correlation between user session and backend trace using Datadog APM and RUM

๐Ÿ”— What is Distributed Tracing?

Distributed tracing tracks a request across multiple services.

Example:

User Request โ†’ API Gateway โ†’ Auth Service โ†’ Payment Service โ†’ DB

Each step becomes a span inside a trace

๐Ÿ”ฅ Key Features

  • Flame graphs (visual request flow)
  • Service dependency maps
  • Trace explorer for debugging
  • Filtering and search capabilities

๐Ÿ‘‰ Trace Explorer helps analyze performance and isolate issues quickly

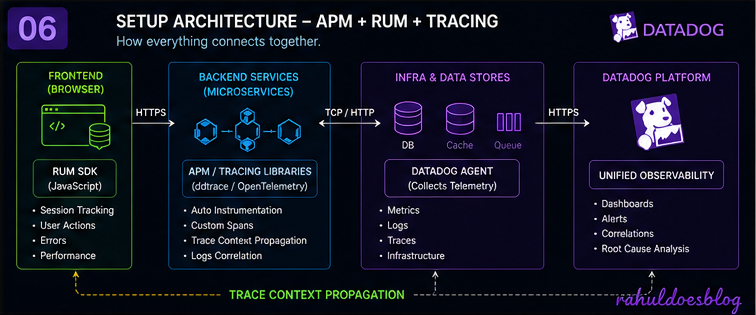
Datadog APM RUM Tracing Architecture Diagram

๐ŸŽฏ Conclusion

Datadog APM + RUM + Tracing provides:

  • ๐Ÿ” Deep visibility into systems
  • โšก Faster troubleshooting
  • ๐Ÿ“ˆ Better user experience

Instead of guessing issues, you:
๐Ÿ‘‰ See the problem โ†’ Trace it โ†’ Fix it

RELATED ARTICLES

TABLE OF CONTENTToggle Table of Content