Table of Contents
๐ง Introduction: Why APM + RUM + Traces Matter
Modern applications are no longer simple โ they are distributed, microservices-based, and user-driven.
Traditional monitoring answers:
- โ Is my server up?
But modern observability answers:
- โ Why is my checkout API slow?
- โ Which user is facing issues?
- โ Which service caused failure?
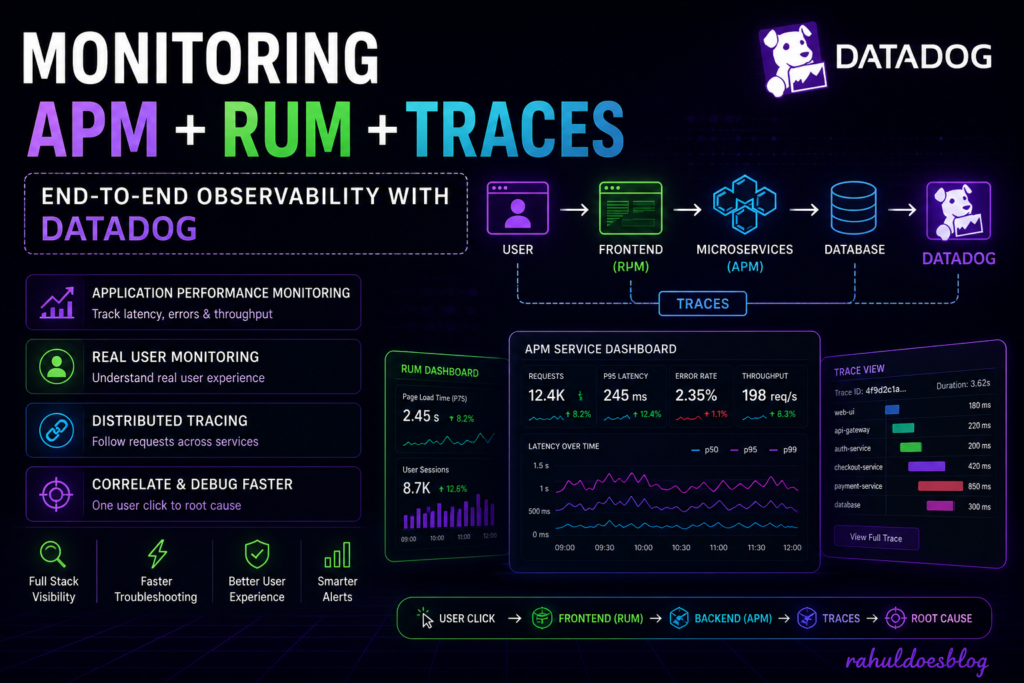
Datadog solves this using:
- APM (Application Performance Monitoring)
- RUM (Real User Monitoring)
- Distributed Tracing
Together, they provide end-to-end visibility from user click โ backend service โ database query
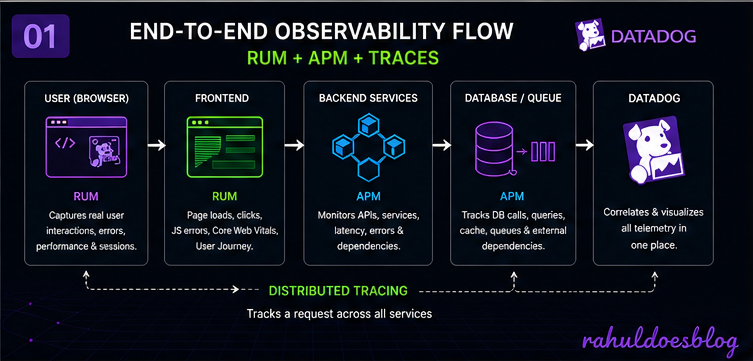
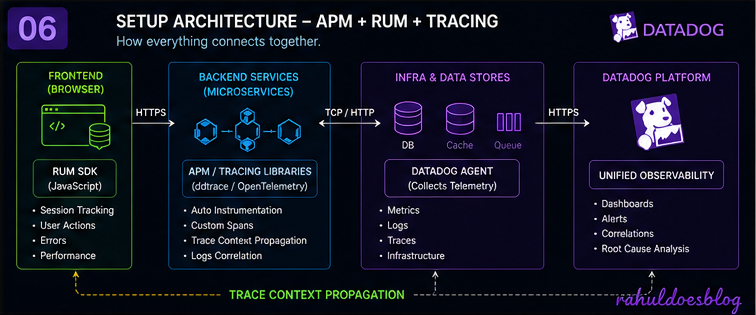
๐๏ธ Datadog Observability Architecture
Flow:
- User interacts with frontend (RUM)
- Request hits backend services (APM)
- Request flows across services (Traces)
- Data correlated in Datadog UI
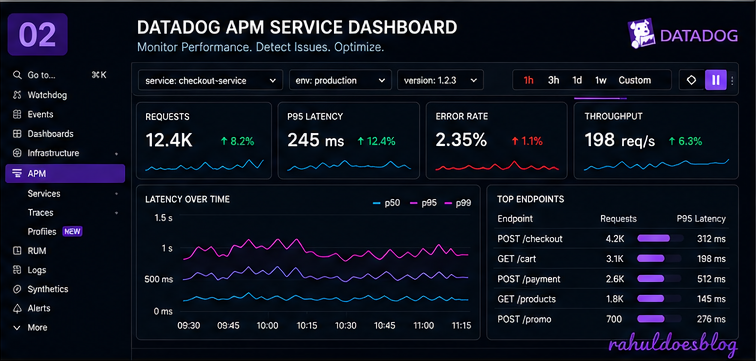
๐ What is Datadog APM?
Datadog APM helps you monitor backend performance using:
- Traces
- Spans
- Latency
- Error rates
Key Concepts:
- Trace = Full journey of a request
- Span = Single operation inside a trace
๐ APM allows you to:
- Detect slow APIs
- Identify bottlenecks
- Monitor service dependencies
Datadog APM provides real-time visibility into services and dependencies across your stack
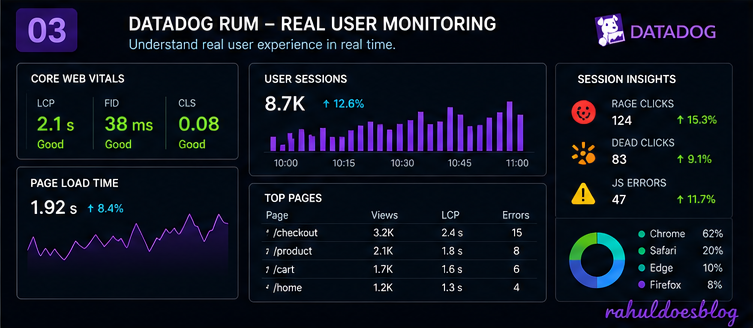
๐ What is Datadog RUM?
RUM captures real user interactions from browsers and mobile apps.
It tracks:
- Page loads
- Clicks
- Errors
- User sessions
- Performance (Core Web Vitals)
RUM provides visibility into real user journeys and frontend issues
๐ฅ Advanced RUM Insights
- Rage clicks (user frustration)
- Dead clicks (no response)
- Slow page loads
- JS errors
๐ Connecting RUM with APM (The Game Changer)
This is where Datadog becomes powerful.
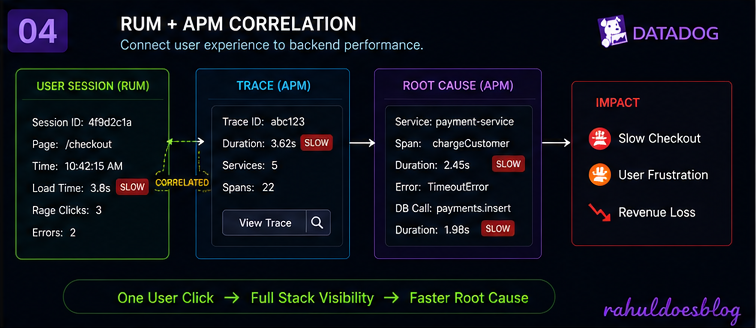
๐ RUM + APM integration allows:
- Link frontend issues โ backend traces
- Identify which API caused user frustration
- Debug full request lifecycle
Datadog enables correlating frontend data with backend traces for full-stack visibility
๐ Example Use Case
๐ฅ Problem:
User complains โCheckout is slowโ
Without Datadog:
- Check logs manually
- Guess root cause
With Datadog:
- RUM shows slow page load
- Trace shows slow API
- Span shows DB query delay
๐ Root cause found in seconds ๐
๐ What is Distributed Tracing?
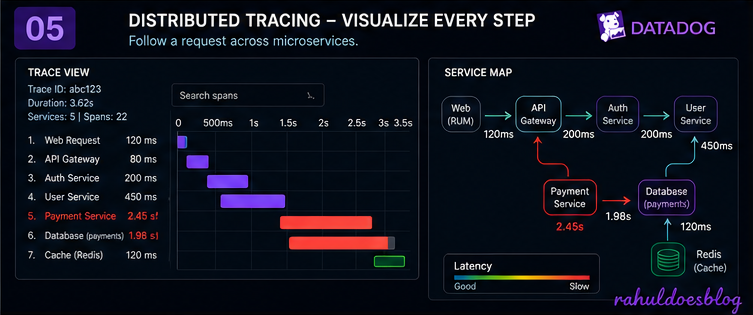
Distributed tracing tracks a request across multiple services.
Example:
User Request โ API Gateway โ Auth Service โ Payment Service โ DB
Each step becomes a span inside a trace
๐ฅ Key Features
- Flame graphs (visual request flow)
- Service dependency maps
- Trace explorer for debugging
- Filtering and search capabilities
๐ Trace Explorer helps analyze performance and isolate issues quickly
๐ What is Distributed Tracing?
Distributed tracing tracks a request across multiple services.
Example:
User Request โ API Gateway โ Auth Service โ Payment Service โ DB
Each step becomes a span inside a trace
๐ฅ Key Features
- Flame graphs (visual request flow)
- Service dependency maps
- Trace explorer for debugging
- Filtering and search capabilities
๐ Trace Explorer helps analyze performance and isolate issues quickly
๐ฏ Conclusion
Datadog APM + RUM + Tracing provides:
- ๐ Deep visibility into systems
- โก Faster troubleshooting
- ๐ Better user experience
Instead of guessing issues, you:
๐ See the problem โ Trace it โ Fix it