Table of Contents
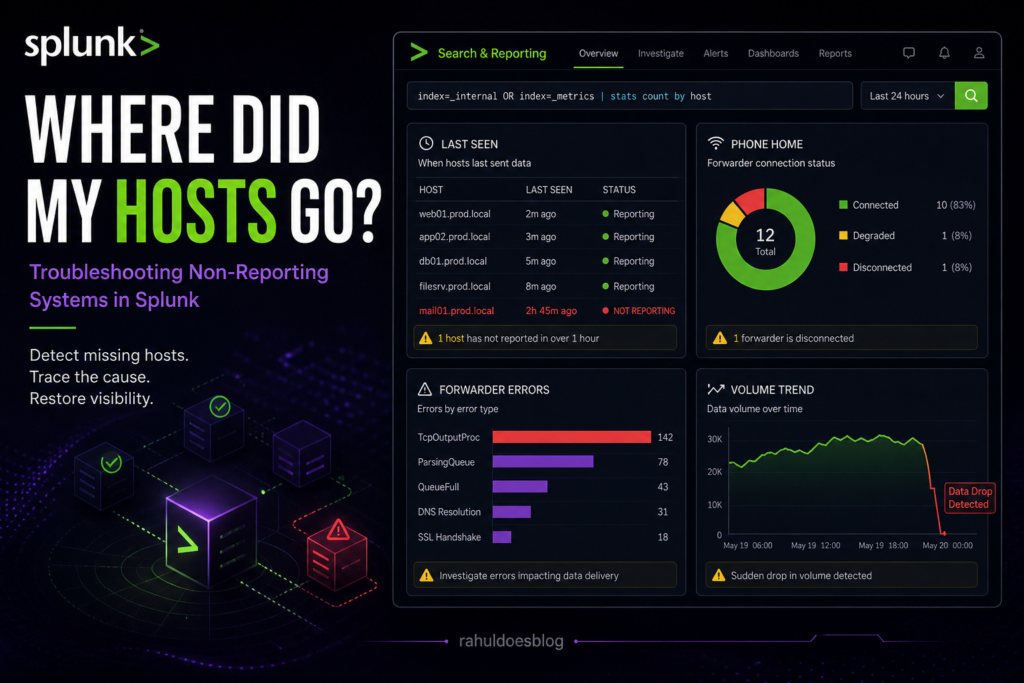
You log into Splunk. Dashboards look clean… maybe too clean.
No alerts. No spikes. No errors.
And that’s exactly when you should worry.
Because in Splunk, no data doesn’t mean no problem — it usually means something is broken.
This guide walks you through a real-world Analyst/Admin workflow to identify why hosts stopped reporting.
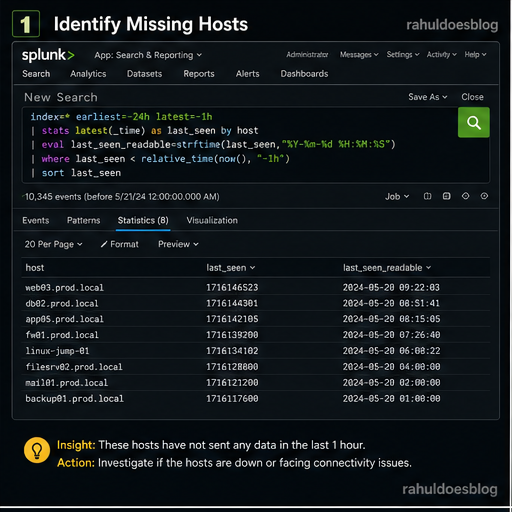
Start by checking which hosts were sending data earlier but have now gone silent.
					index=* earliest=-24h latest=-1h
| stats latest(_time) as last_seen by host
| eval last_seen_readable=strftime(last_seen,"%Y-%m-%d %H:%M:%S")
| where last_seen < relative_time(now(), "-1h")
| sort last_seen
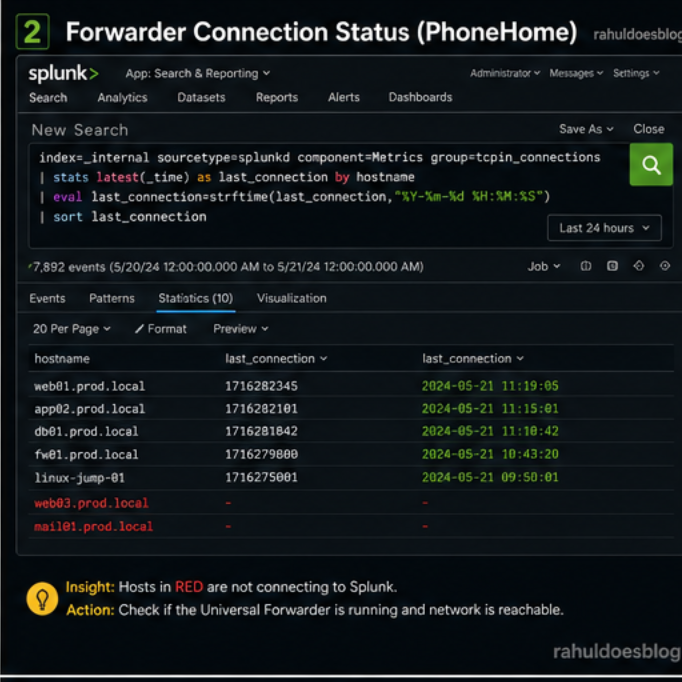
Now validate if the Universal Forwarder is still talking to Splunk
					index=_internal sourcetype=splunkd component=Metrics group=tcpin_connections
| stats latest(_time) as last_connection by hostname
| eval last_connection=strftime(last_connection,"%Y-%m-%d %H:%M:%S")
| sort last_connection
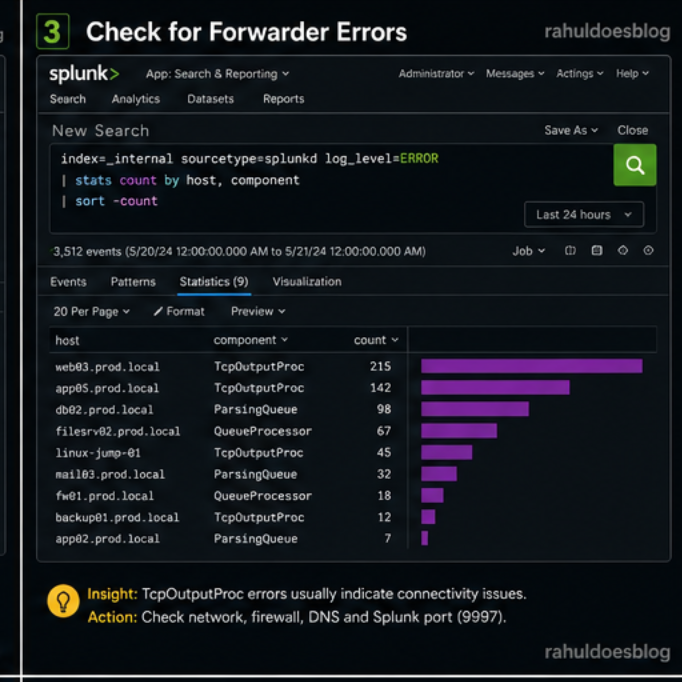
Time to inspect internal logs for issues.
TcpOutputProc
ParsingQueue
QueueProcessor
					index=_internal sourcetype=splunkd log_level=ERROR
| stats count by host, component
| sort -count
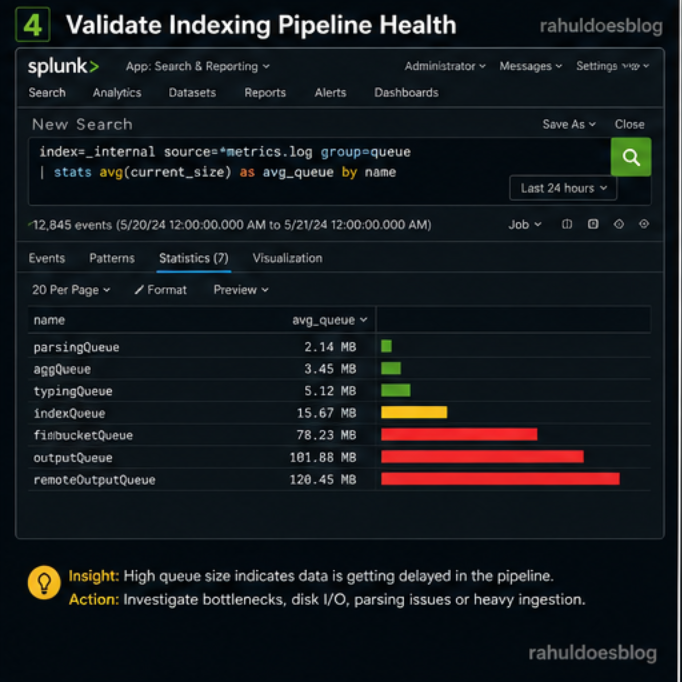
Even if forwarders are sending data, indexing might be broken.
					index=_internal source=*metrics.log group=queue
| stats avg(current_size) as avg_queue by name
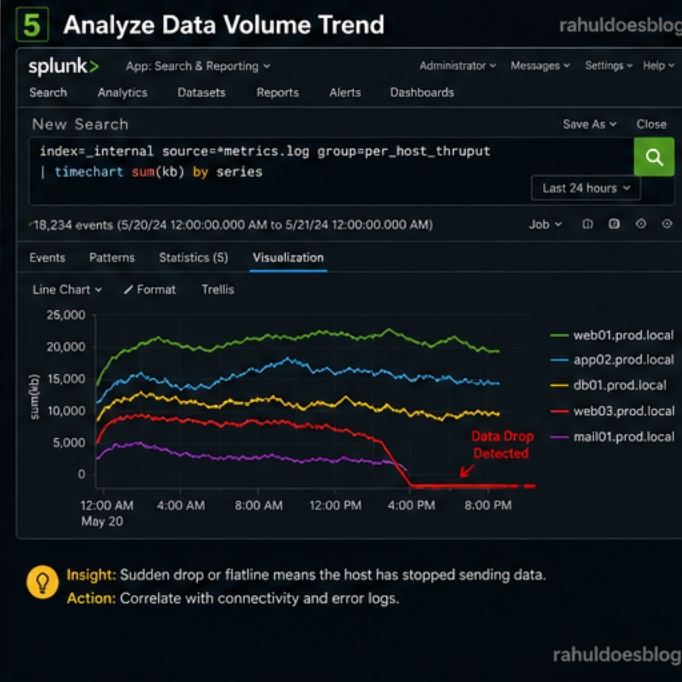
Sometimes hosts are not completely down — just sending less data.
					index=_internal source=*metrics.log group=per_host_thruput
| timechart sum(kb) by series
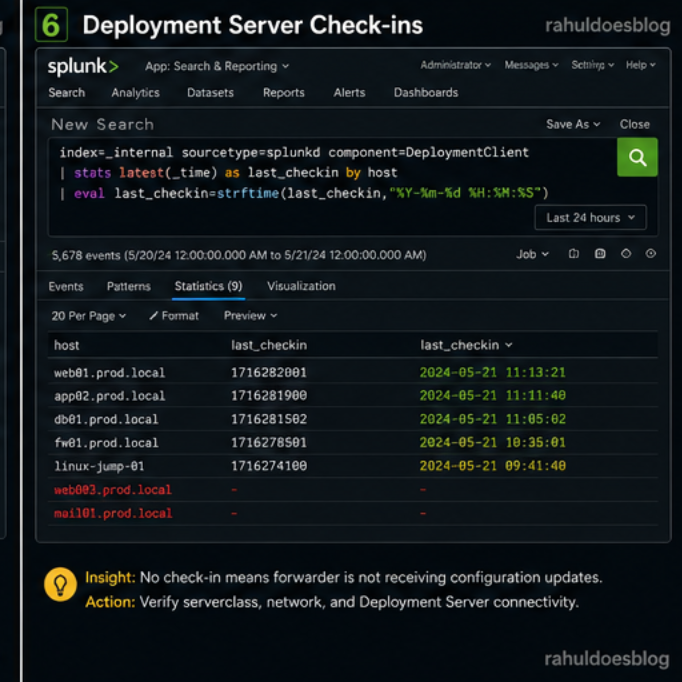
Check if forwarders are still receiving configs.
					index=_internal sourcetype=splunkd component=DeploymentClient
| stats latest(_time) as last_checkin by host
| eval last_checkin=strftime(last_checkin,"%Y-%m-%d %H:%M:%S")
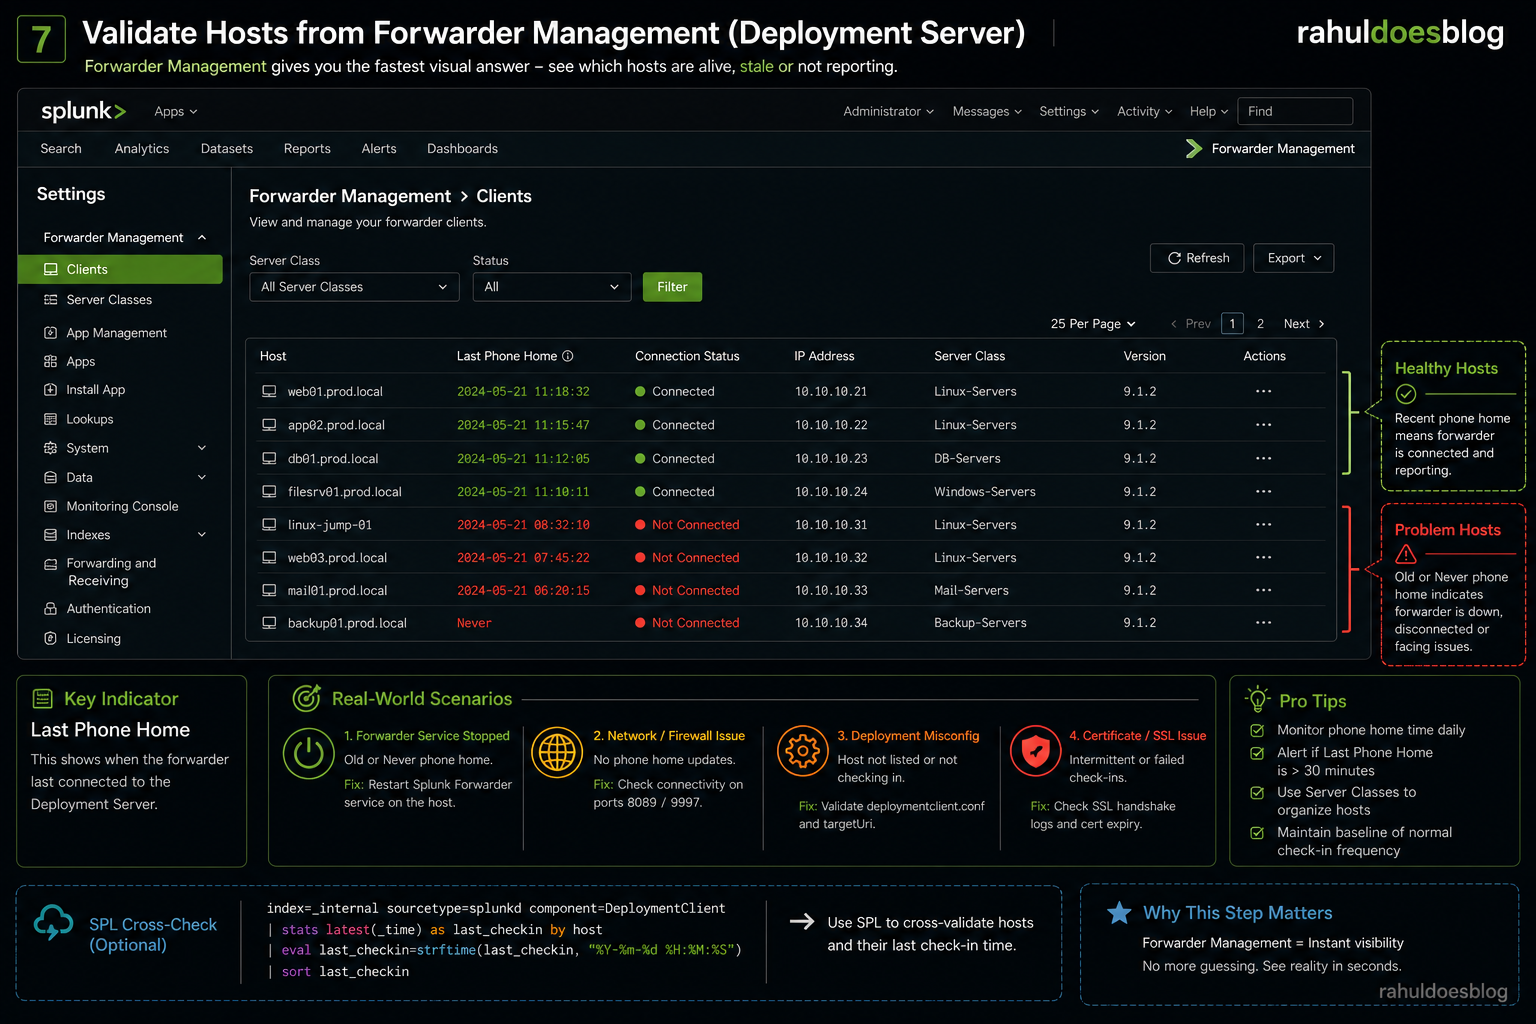
When hosts stop reporting, checking _internal logs is useful — but Forwarder Management gives you the fastest visual answer.
_internal
This is where you stop guessing and see reality instantly.
Go to:
Settings → Forwarder Management → Clients
You’ll get a table with:
👉 “Last Phone Home”
This tells you when the forwarder last connected to the Deployment Server.
In Splunk, silence is never peaceful — it’s suspicious.
The faster you detect missing hosts, the faster you prevent blind spots in your security posture.